12. Quiz: What Defines A Line? - Line Basics Quiz
Quiz - Line Basics
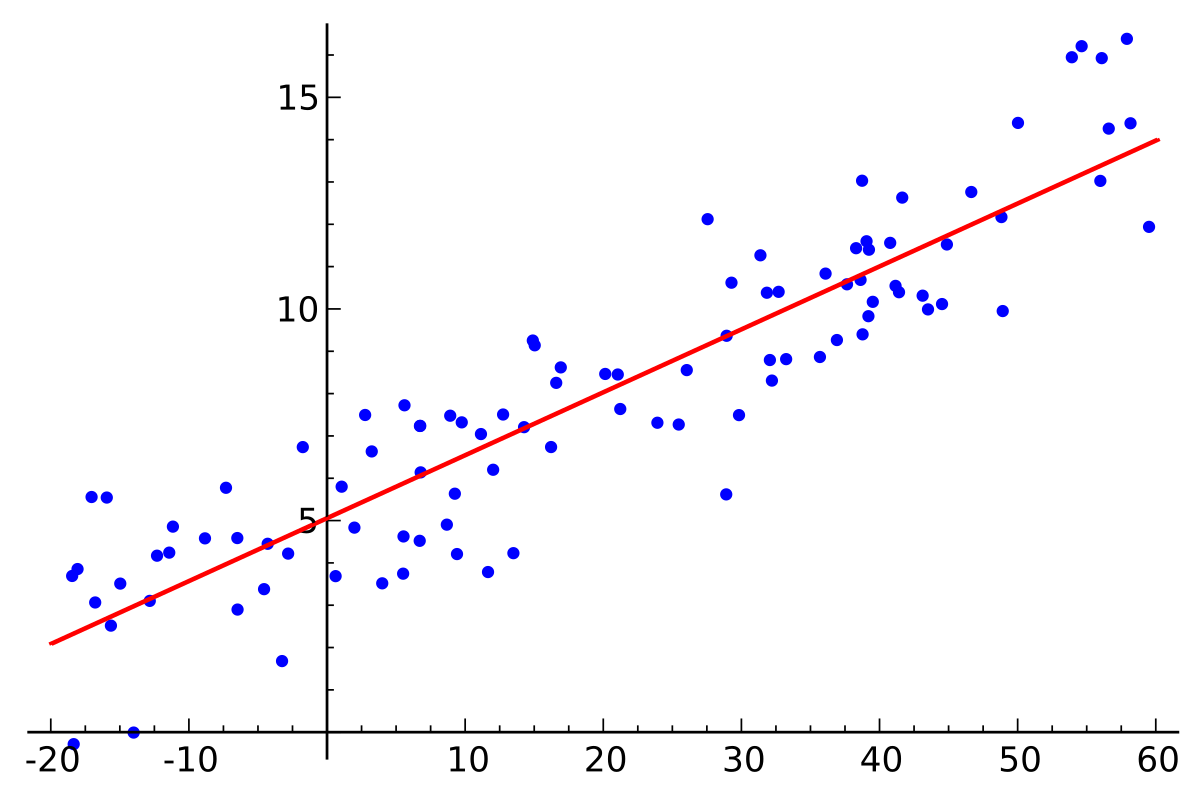
For many months, I keep track of the number of hours I work compared to a standard 40 hour week, where -20 represents 20 total hours of work for the week, and 60 is +60 on top of the standard for (or 100 hours for the week). The hours are represented on the x-axis. On the y-axis, is some measure of how happy my boss is with me for the same week. The higher this value, the happier my boss is with me.
Use this information and the plot to answer the following questions.
SOLUTION:
- If you work 40 hours per week, we expect your boss to be at a happiness level of 5.
- As you work more hours, we expect the happiness of your boss to increase.
- For each additional hour worked, we can predict an approximately 0.125 increase in the happiness of your boss.